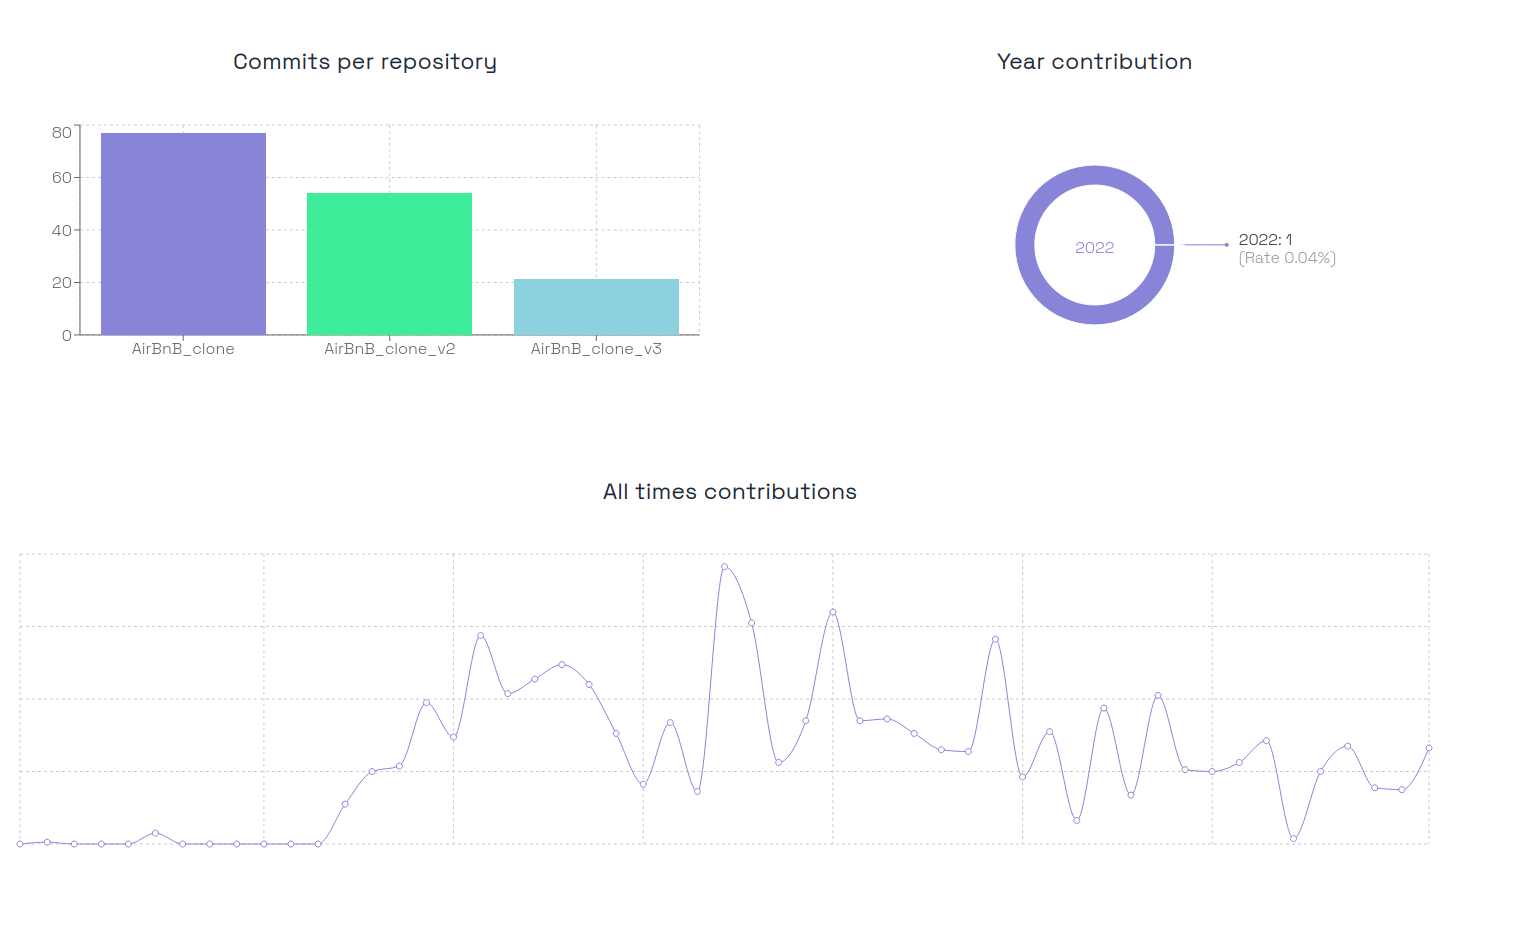
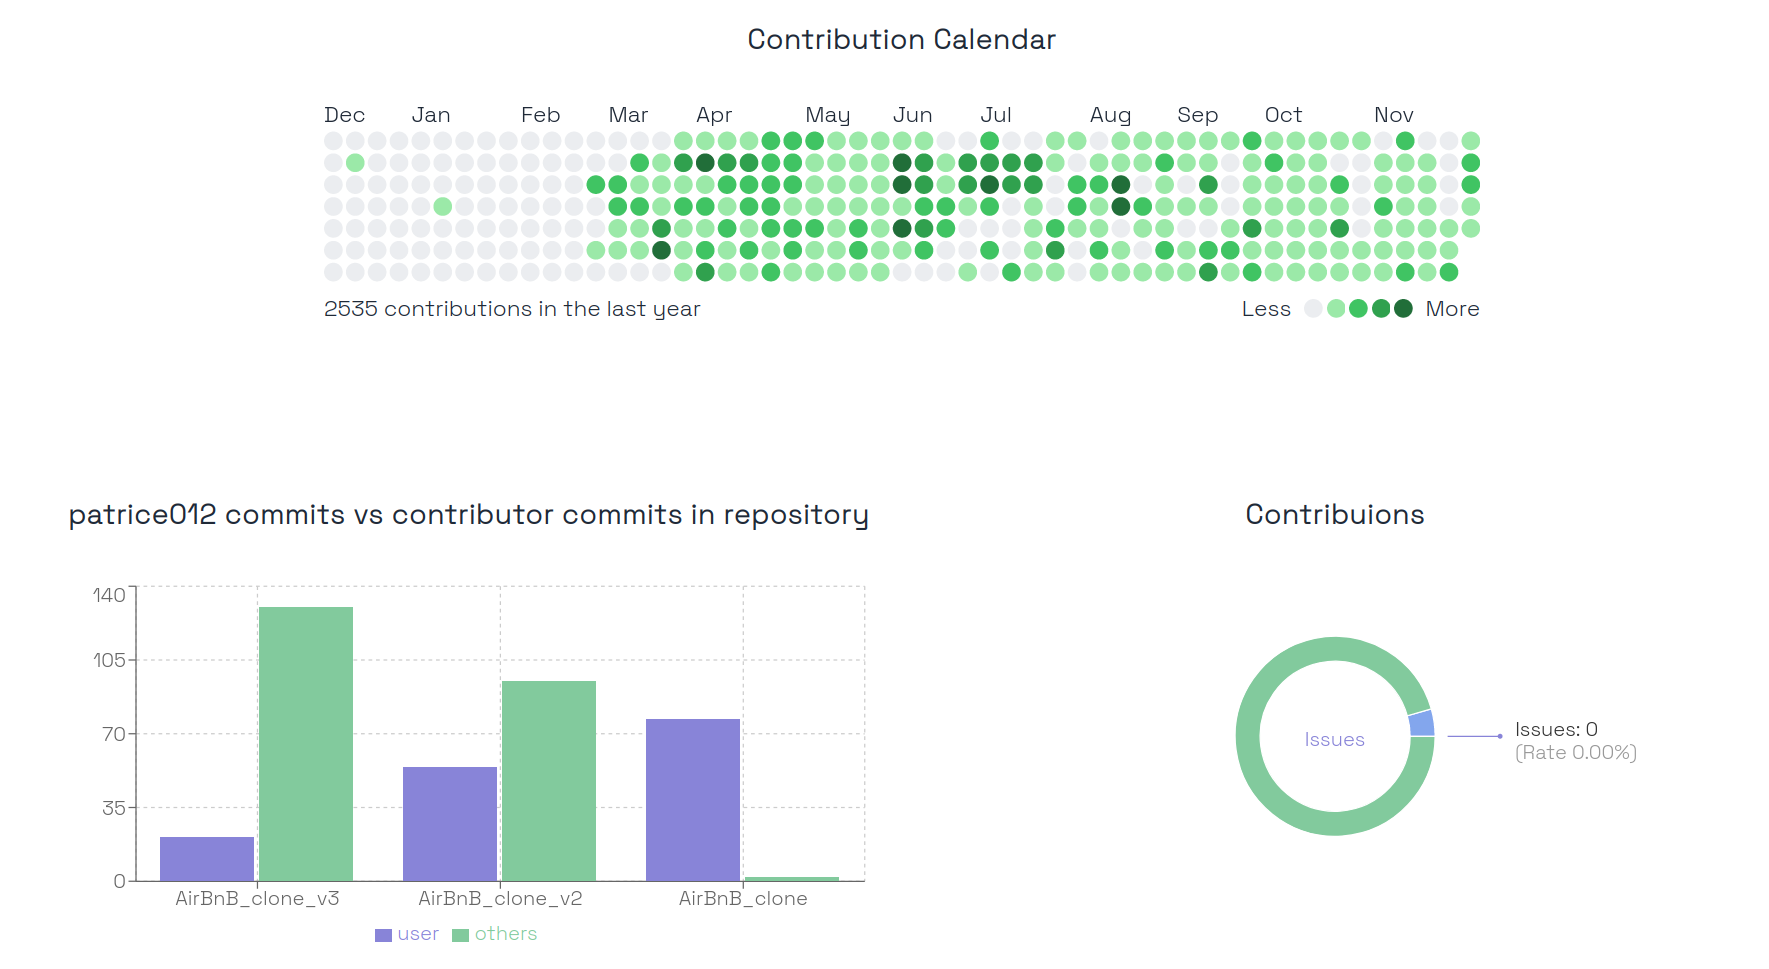
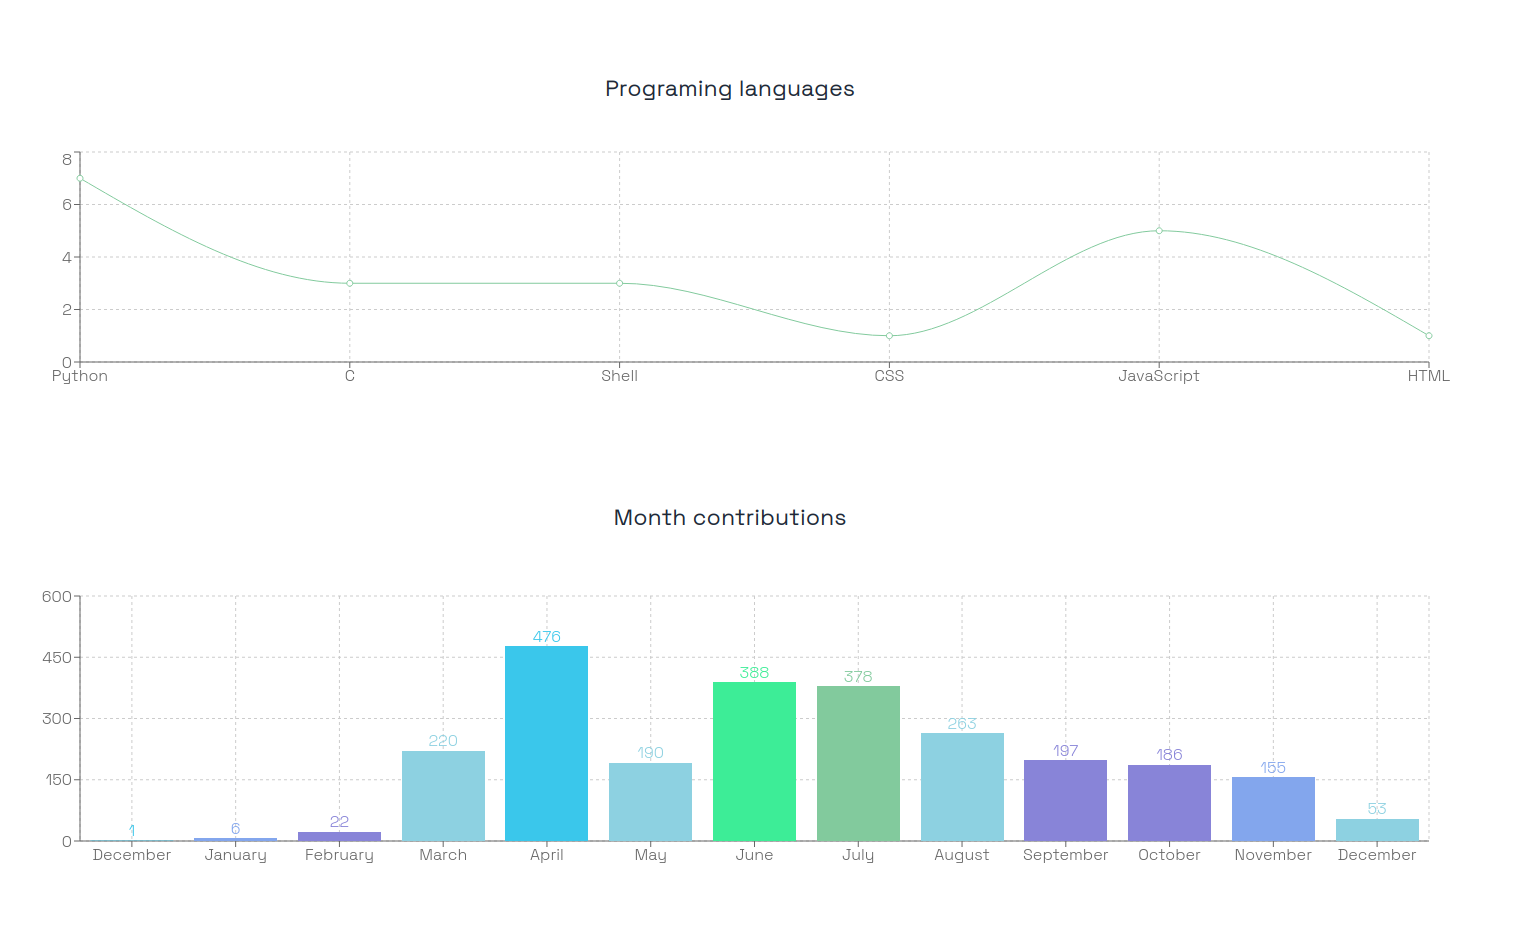
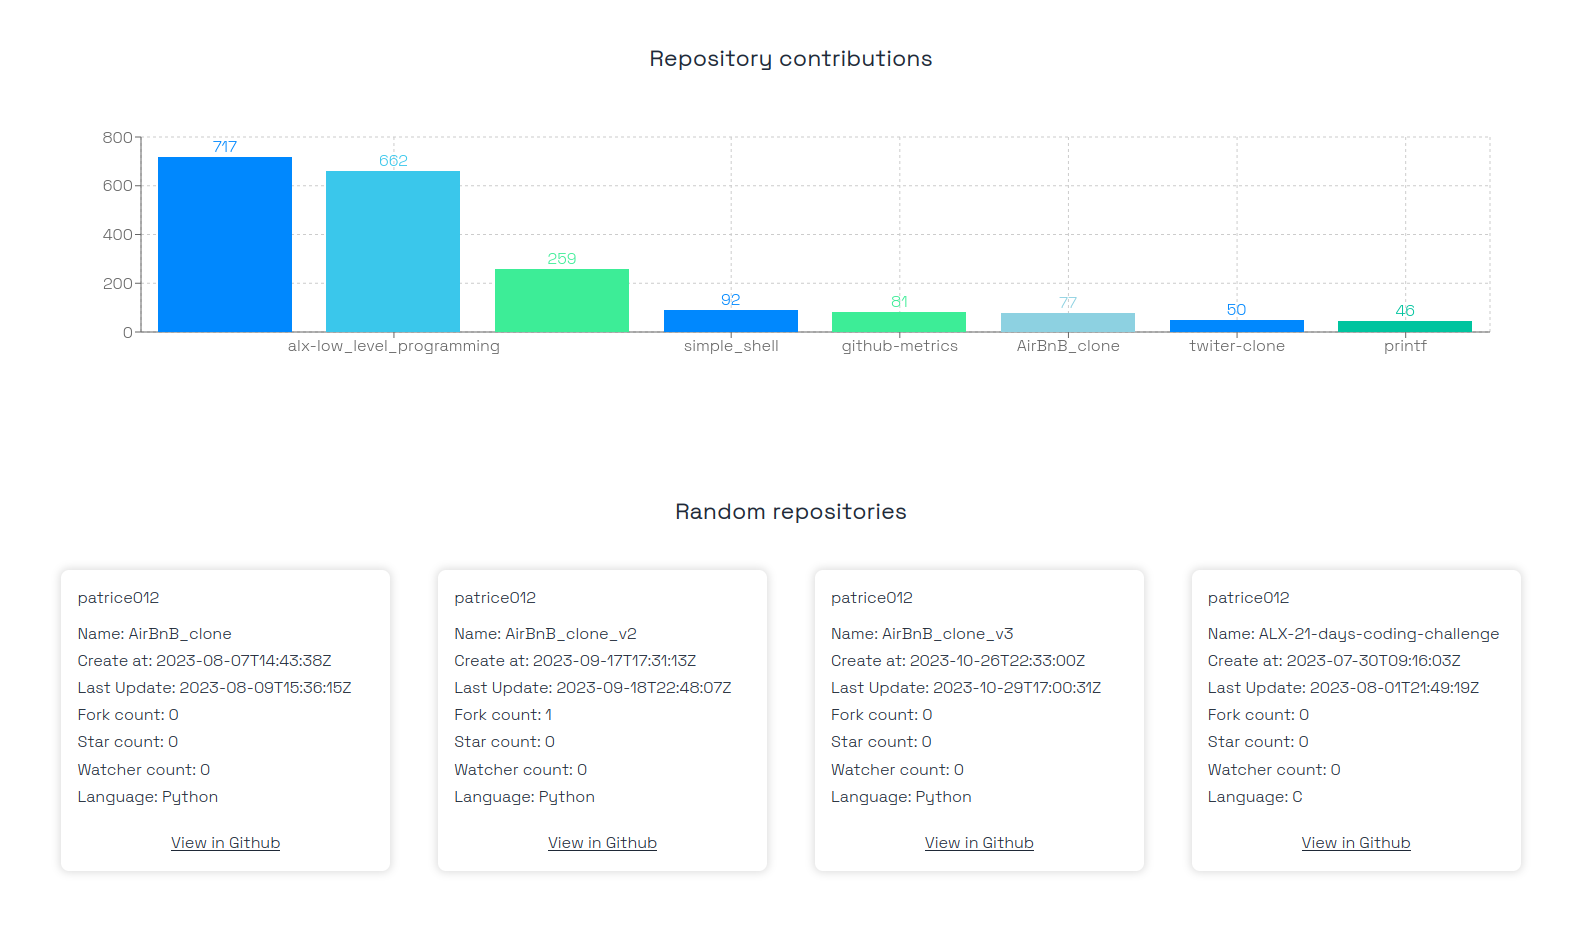
GitHub-Metrics is more than just a project; it's a testament to my commitment to making technology more accessible and meaningful for individuals navigating the expansive GitHub landscape. The inspiration behind this endeavor can be traced back to a genuine fascination with the power of data visualization and its potential to empower users. As a developer, I've always found the GitHub platform to be a treasure trove of information about one's coding journey. However, I observed a gap - a lack of tools that truly put the user at the center, offering not just raw data but a visual and intuitive representation of their GitHub activity.
The project's journey commenced with a simple yet profound idea: to create a tool that enables users, from seasoned developers to GitHub newcomers, to effortlessly explore and comprehend their GitHub metrics. The aim was clear - to transform complex data into meaningful insights, fostering a deeper understanding of individual coding patterns, project contributions, and community engagement. In the initial phases, the focus was on identifying the specific needs of GitHub users. What metrics matter most to developers? How can we present this information in a way that is both informative and enjoyable to interact with? These questions fueled the development process and led to the evolution of GitHub-Metrics into a robust and user-centric platform.


